CE / CME
Assessing PBC Response to First-line UDCA Therapy
Pharmacists: 0.75 contact hour (0.075 CEUs)
Physicians: maximum of 0.75 AMA PRA Category 1 Credit™
Nurse Practitioners/Nurses: 0.75 Nursing contact hour
Released: March 18, 2026
Expiration: March 17, 2027

Activity
UDCA Response Measurement
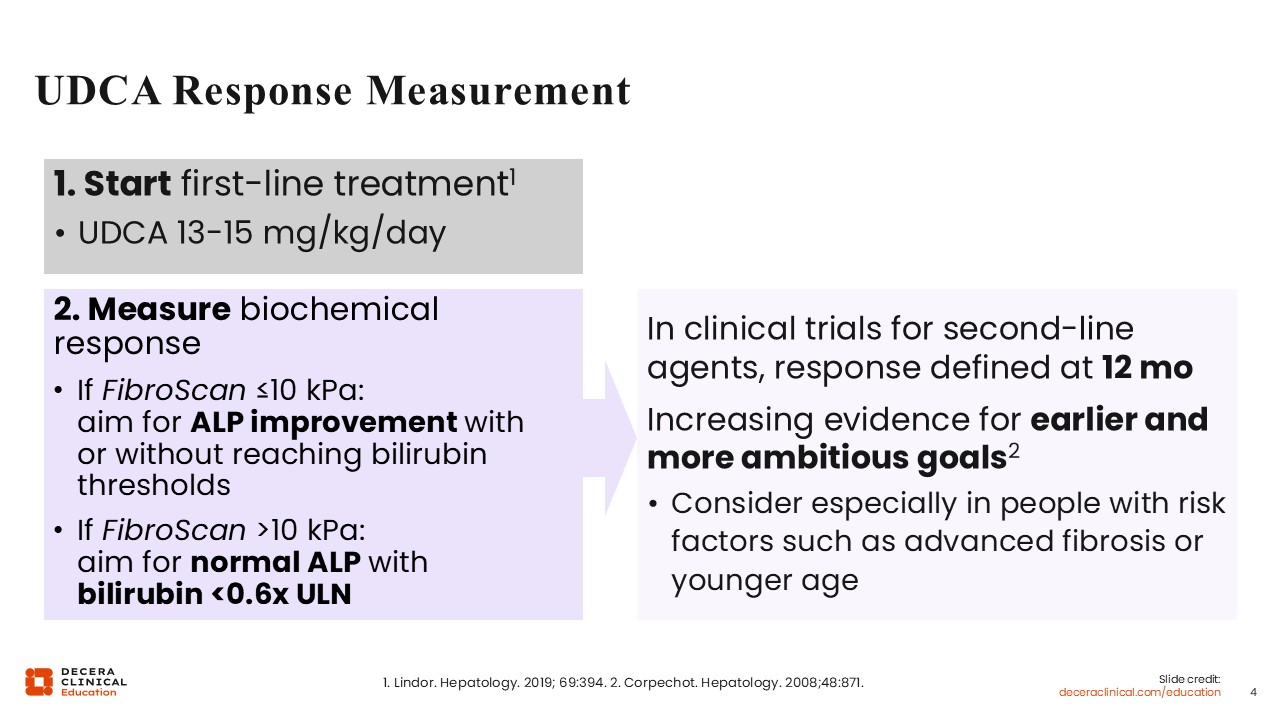
The key is assessing treatment response early enough to prevent delays in the timely initiation of second-line therapy. This approach may lead to better long-term outcomes, especially for those with more advanced disease.1,4
Traditionally, response is defined at 12 months. However, there is increasing evidence for measuring response earlier, especially in people with risk factors for more severe disease.1,4
Identifying Nonresponders to First-line Treatment: Assessing Response at 6 Mo
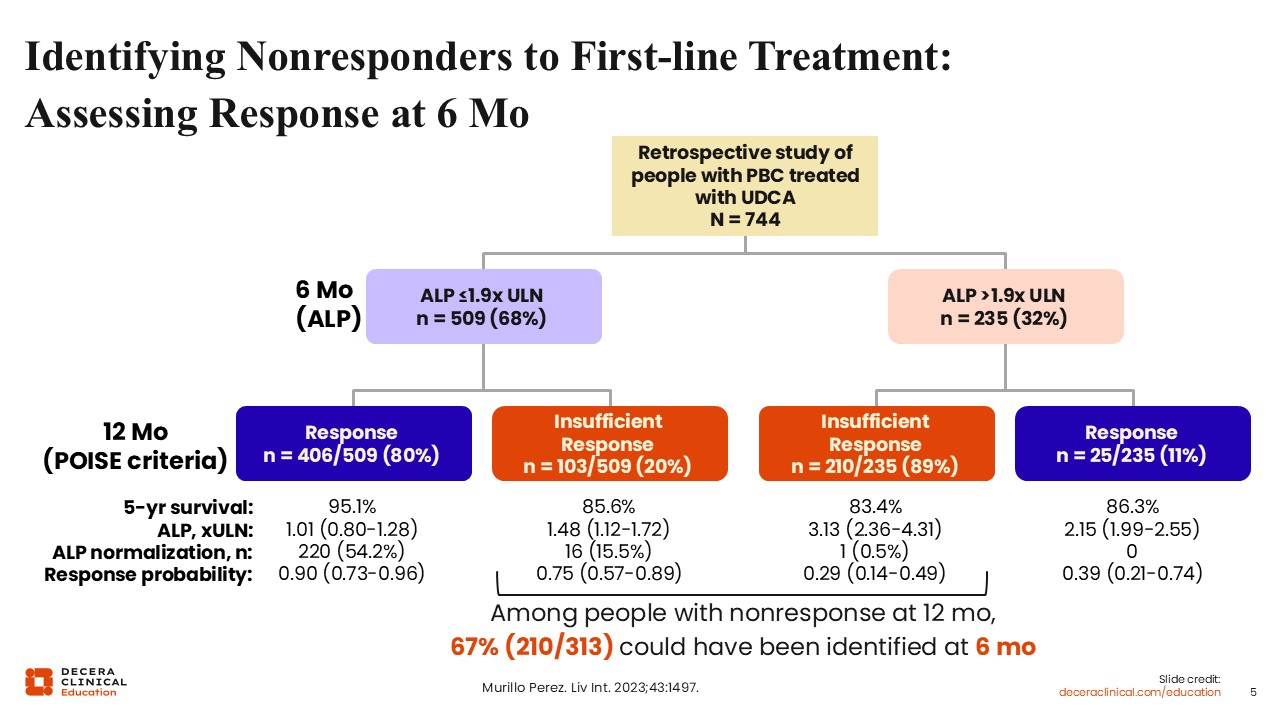
A retrospective study of people with PBC who were treated with UDCA investigated whether earlier assessment of treatment response was better able to identify nonresponders and whether earlier identification of nonresponders led to better outcomes.5
Investigators first assessed participants’ ALP at 6 months. In this study, treatment response at 6 months was defined as ALP ≤1.9 times the ULN. Approximately 68% met the criteria for treatment response, while 32% did not.
Then, investigators reassessed these participants at 12 months using the POISE criteria, which defines treatment response as ALP <1.67 times the ULN, an ALP reduction ≥15% from baseline, and normalization of total bilirubin. Of those who were originally identified as nonresponders at 6 months, according to their ALP levels, nearly 90% were still categorized as nonresponders at 12 months, per the POISE criteria.5
The key here is that there are many patients who could have been identified as nonresponders early and could have advanced to the addition of second-line therapy earlier. People with risk factors for more rapid disease progression, like higher liver stiffness, would likely benefit from assessment of response and add-on therapy at 6 months if there is a trend towards inadequate response, rather than waiting for another assessment at 12 months.5
Risk-Based Assessment: What I Do
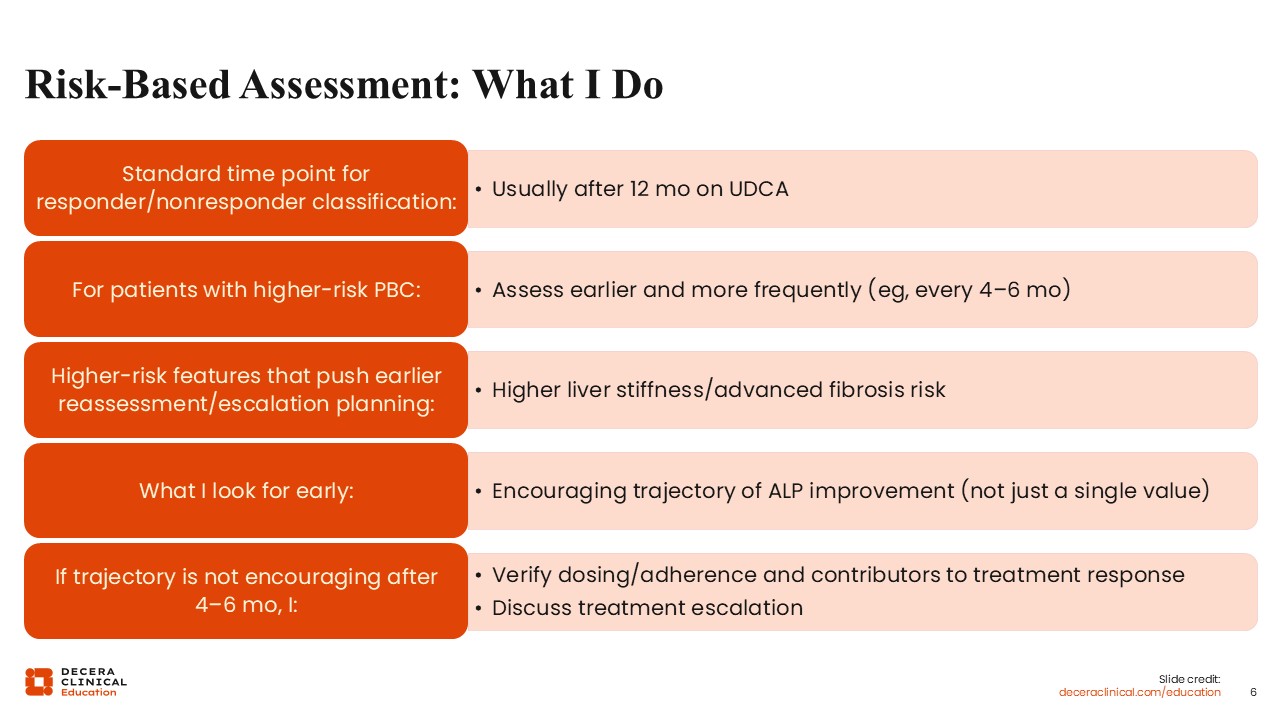
I believe we should try to normalize ALP sooner for high-risk patients because their window of time to disease progression is much shorter than that of patients in earlier stages.5
In my practice, earlier and more frequent assessment of treatment response is the standard of care for patients with risk factors for severe or more advanced disease. For example, if a patient has high liver stiffness, I would follow up with them every 4-6 months. If I do not see an encouraging trajectory of improvement in the first 4-6 months, I would probably think about escalating therapy more quickly, rather than waiting for another assessment in 6 months, when the patient may already be en route to cirrhosis.
In my practice, I do assess treatment response in patients with PBC before 12 months, usually within 6 months. Whether I recommend a change in their treatment depends on each patient’s individual trajectory. There is no clear cut-off.
For example, if a patient started with an ALP 3 times the ULN, and at 6 months they are down to 1.9 times the ULN, I probably would not change their treatment. In this case, there is a clear 40% reduction in ALP at 6 months post treatment initiation, which, to me, indicates that the therapy is working. For this patient, I would probably wait until 12 months to make a decision, to see if their current therapy further reduces their ALP, or if they have already derived the maximum benefit from it.
However, if a patient started with an ALP 3 times the ULN and at 6 months has only achieved reduction to 2.5-2.6 times the ULN, I would think that this trajectory is probably predictive of inadequate response. This is a patient with whom I would discuss adding second-line therapy, rather than waiting another 6 months to confirm what is most likely an inadequate response to treatment.
Data are currently lacking about whether early identification of treatment response can help translate into a better long-term response, but many experts, including me, are using this approach.
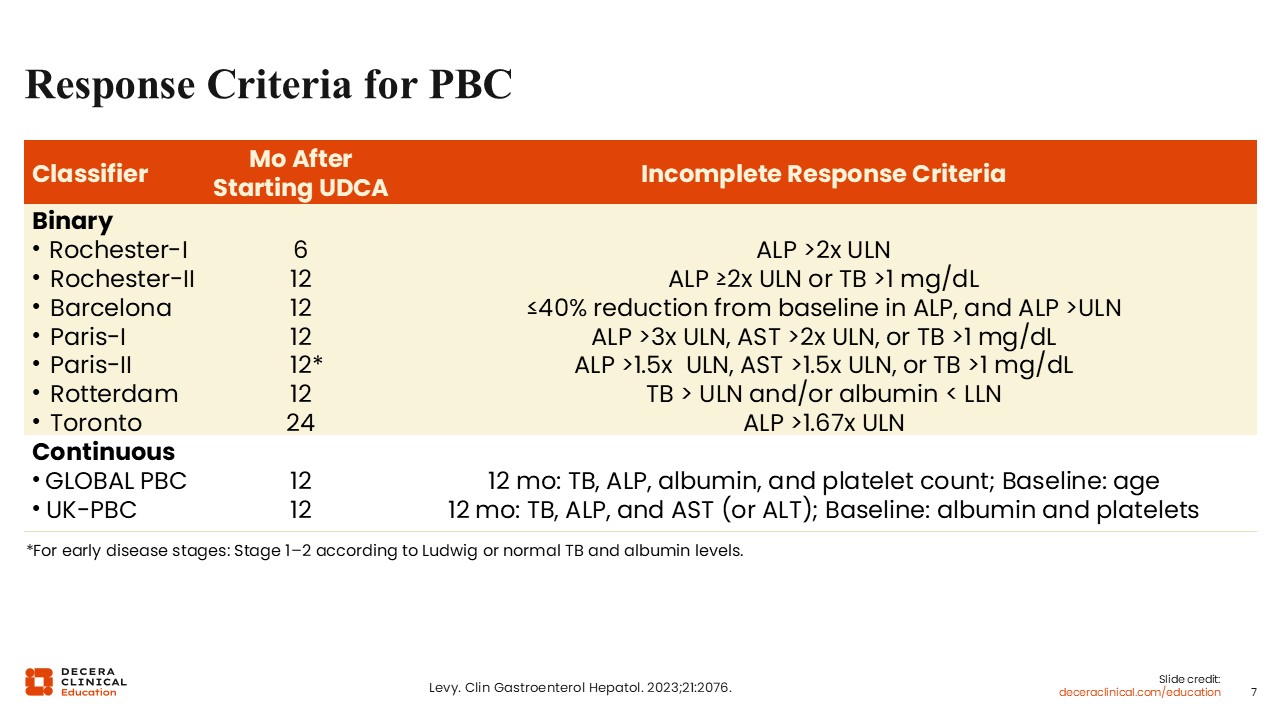
Response Criteria for PBC
In addition to deciding when to assess the treatment response, choosing which response criteria to use also requires nuance. There are many response criteria for PBC. Most of them assess response at 12 months and assess for improvement in ALP and total bilirubin. Some, like the Paris criteria, also take liver enzymes into consideration.2
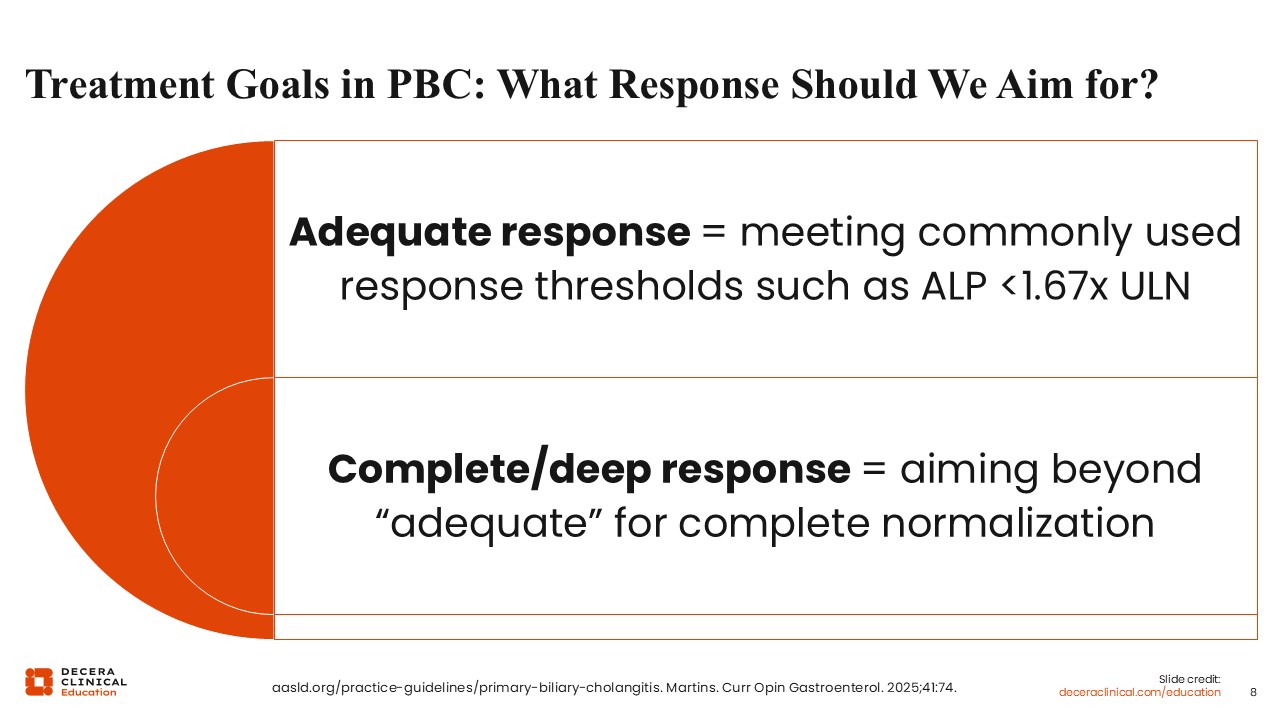
Treatment Goals In PBC: What Response Should We Aim For?
So, what response should we aim for? Many phase III studies for second-line PBC therapies define treatment goals similar to the POISE criteria for treatment response: ALP <1.67 times the ULN and total bilirubin ≤1 times the ULN. However, is lower better? That is, ALP <1.67 times the ULN is good, but should we be aiming for complete normalization of ALP and even lower total bilirubin?6
There are more data now suggesting that we should be aiming for stricter endpoints. Current research implies that complete normalization of ALP and lower total bilirubin may be associated with better outcomes, especially in patients with more advanced disease.6
Generally, adequate response means meeting the thresholds for treatment response, for example, achieving ALP <1.67 times the ULN. Complete or deep response alludes to complete ALP normalization as well as normalization of total bilirubin. Some studies use <0.6 times the ULN as a cutoff for complete or deep total bilirubin response.7
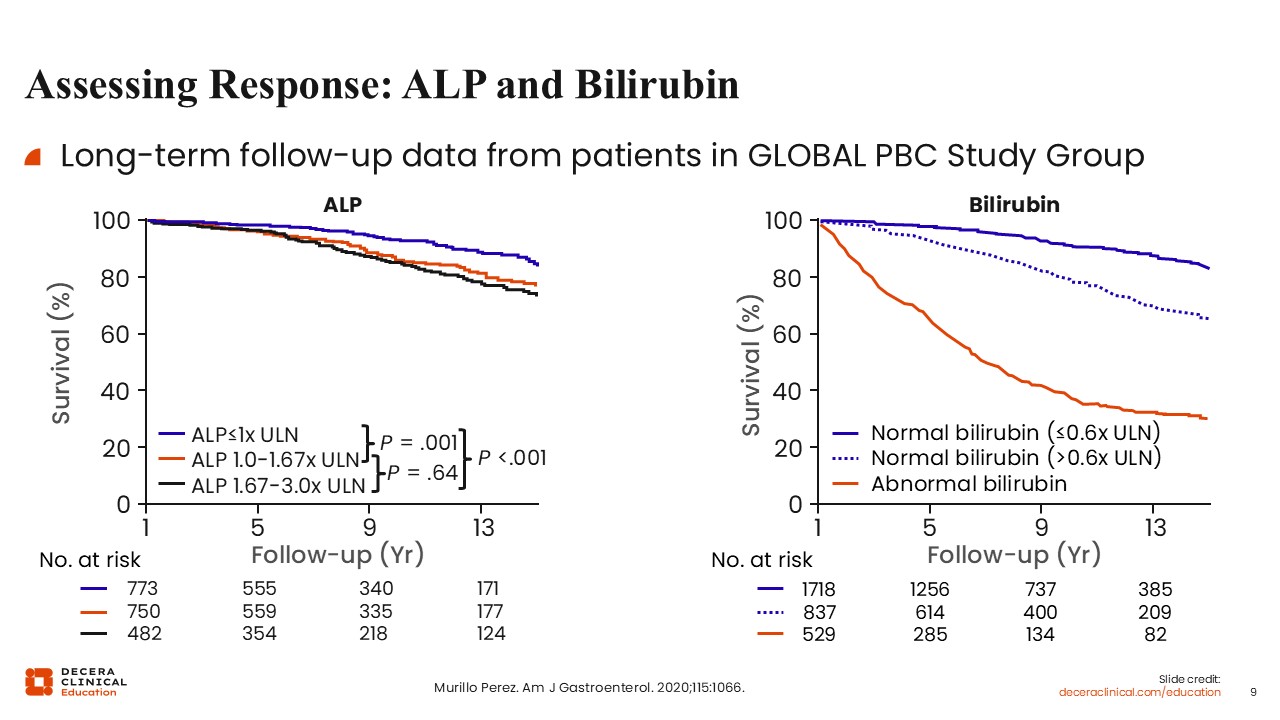
Assessing Response: ALP and Bilirubin
Long-term follow-up data from patients in the GLOBAL PBC Study Group clearly illustrate the association between lower ALP, lower bilirubin, and improved survival. The figure on the left shows that patients who achieved complete ALP normalization had significantly better survival, even better than those who achieved treatment response per the POISE criteria: normalizing ALP was better than just getting it below 1.67 times the ULN.8
The figure on the right illustrates a similar association with total bilirubin and survival. Those who achieved lower bilirubin (≤0.6 times the ULN) had better survival than those with high bilirubin and those with normal bilirubin (>0.6 times the ULN).8
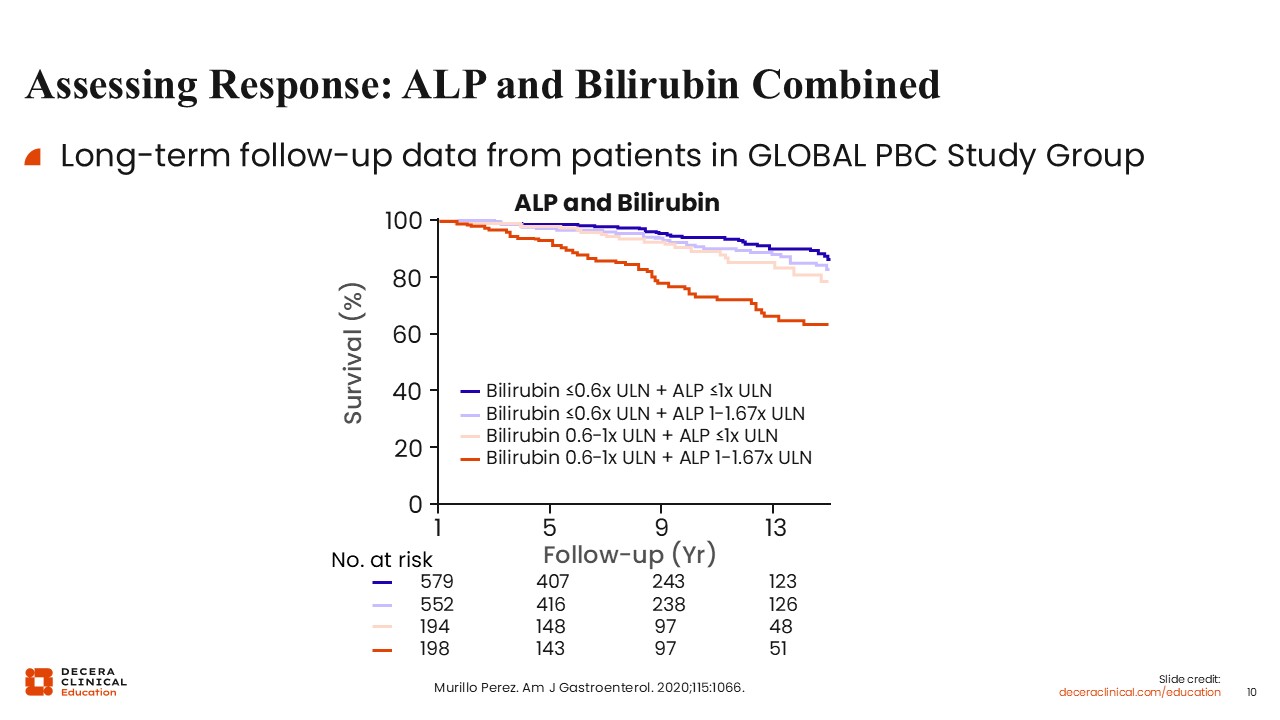
Assessing Response: ALP and Bilirubin Combined
When investigators combined the 2 assessment parameters, the data showed that patients with complete normalization of ALP and bilirubin <0.6 times the ULN had better survival.8
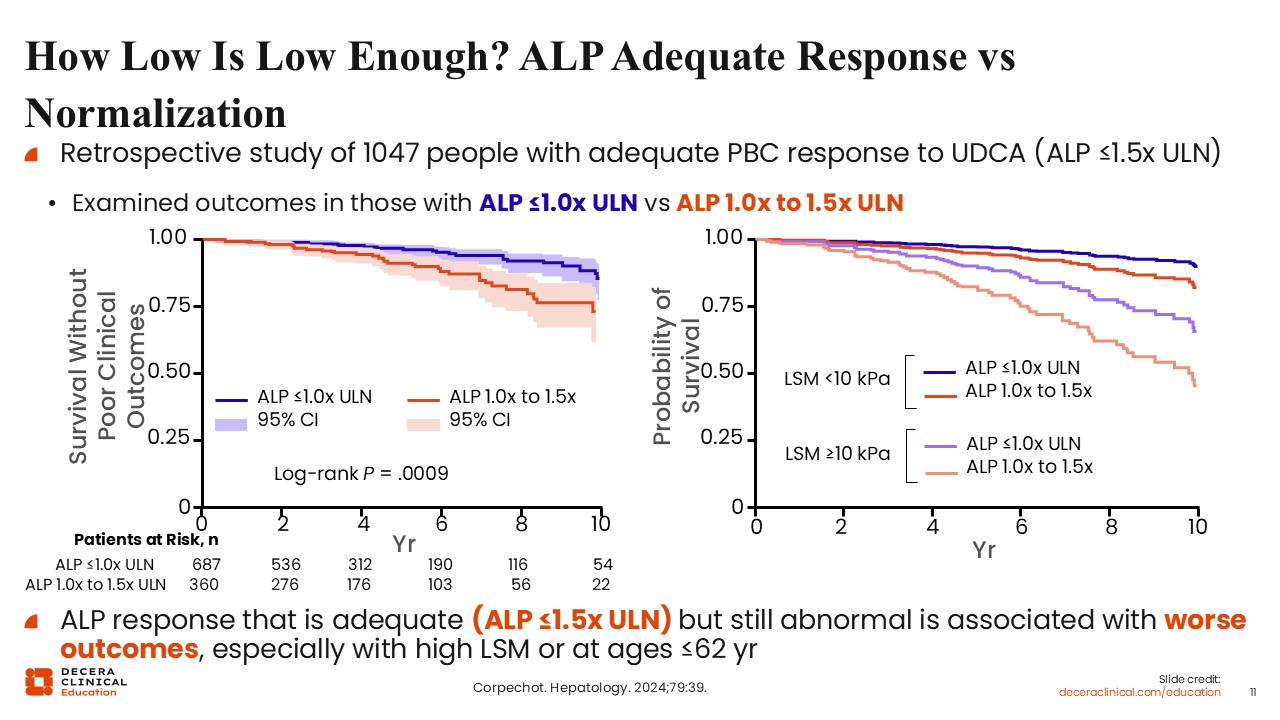
How Low Is Low Enough? ALP Adequate Response vs Normalization
A more recent retrospective study sought to answer whether ALP complete normalization is best. The orange lines on the graphs represent participants who had adequate treatment responses of ALP 1.0-1.5 times the ULN, but not completely normal. The blue line represents those who achieved complete normalization, ALP ≤1.0 times the ULN.9
Just based on ALP levels alone, the data show that complete normalization of ALP is associated with significantly better survival.9
When liver stiffness is brought into the equation, the results become a little more complicated, but you can see the same pattern. Whether baseline liver stiffness is high or low, patients with lower ALP fared better than those with higher ALP.9
The key message here is that even if patients achieve an adequate treatment response (ALP 1.0-1.5 times the ULN), those with complete ALP normalization do better, regardless of whether they have high or low liver stiffness. This means that regardless of whether patients have advanced disease, normalization of ALP is associated with better outcomes.9
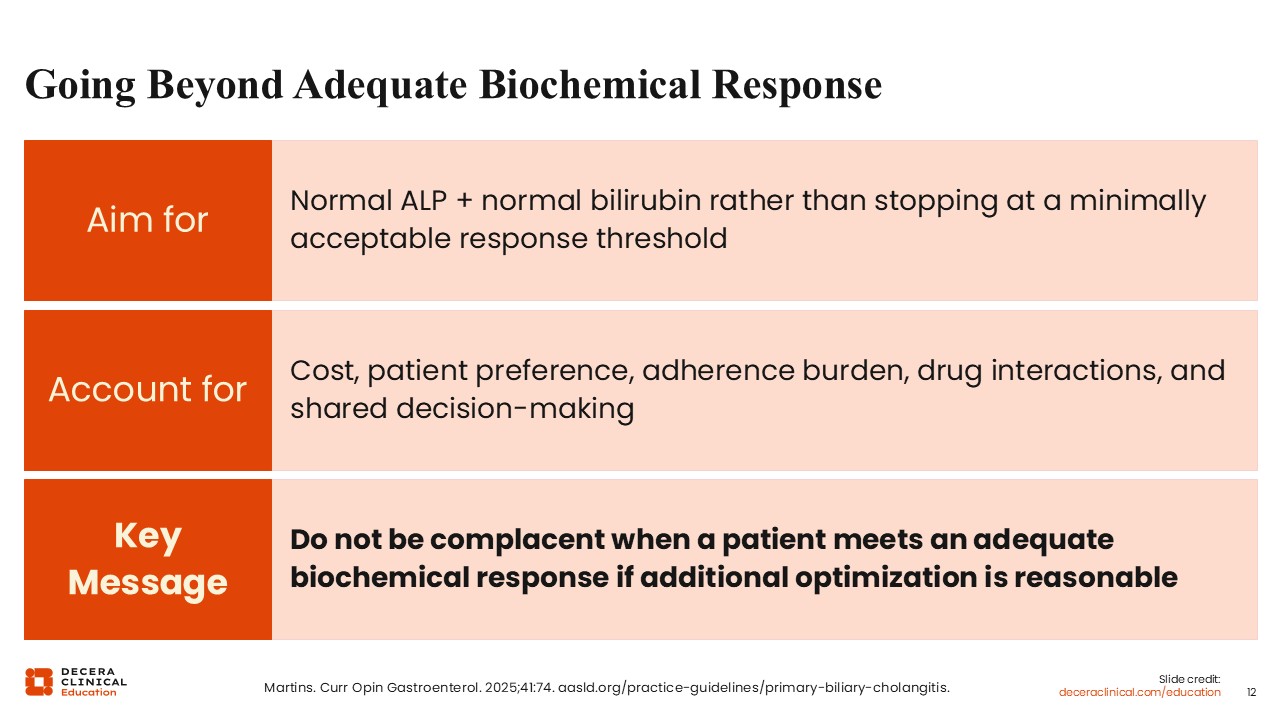
Going Beyond Adequate Biochemical Response
In a perfect world, all people with PBC would have normalized ALP, but there are still practical factors to consider, like out-of-pocket costs, patient preference, and drug–drug interactions. When possible, and when it makes sense clinically, HCPs should use shared clinical decision-making to try and optimize treatment to reach complete normalization of ALP and bilirubin.
I think there's an art to optimizing treatment for PBC. There are ideal goals, but treatment decisions often come down to a judgment call. Ultimately, I think we should make treatment decisions in the context of patients’ overall health trajectory, not just a single value.
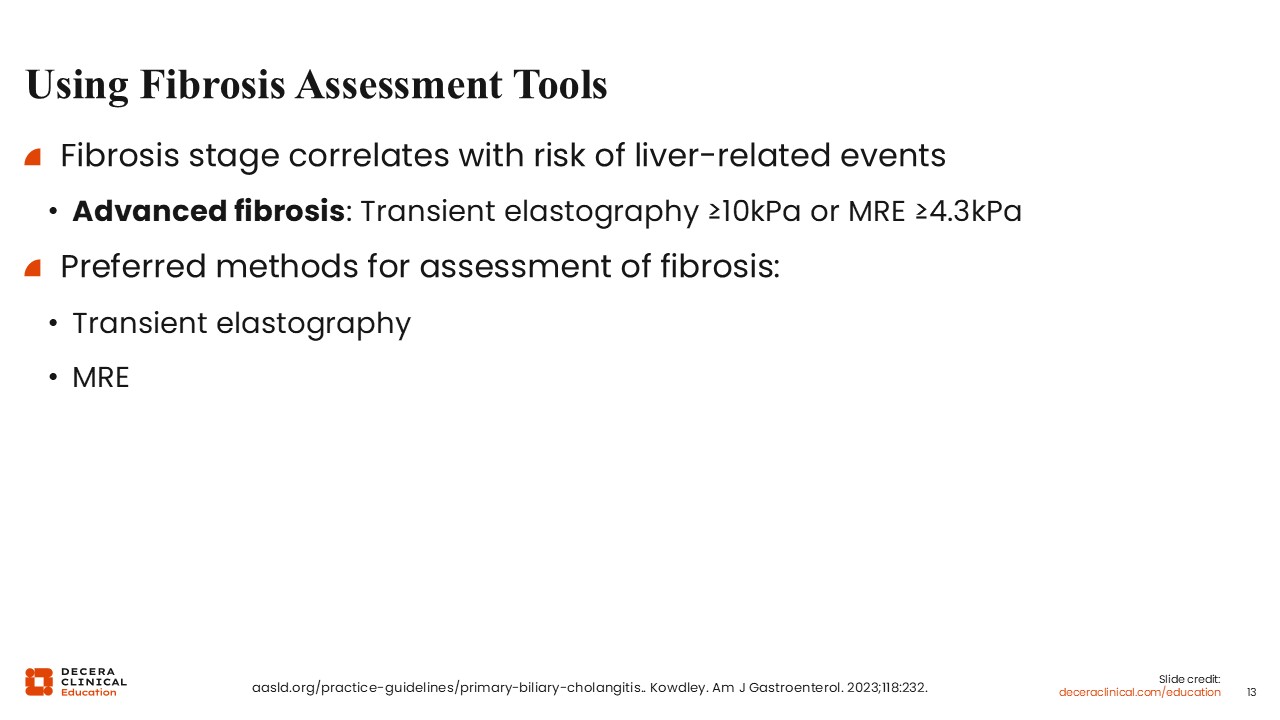
Using Fibrosis Assessment Tools
There are many tests available to measure fibrosis.6,10 However, these tests were not designed or widely validated in the context of PBC. Most of the liver stiffness data is based on metabolic dysfunction-associated steatotic liver disease, steatotic liver disease, and viral hepatitis. HCPs need to take the interpretation with a grain of salt.6
That’s why I find that these tests have the most utility when they are used to gauge a trajectory, rather than to measure a single time point. When measuring the trajectory of disease, the absolute numbers in the test results matter less, but the trends will still make it apparent if the patient's liver status is getting worse or if they are responding to treatment.
Ultimately, I don't put that much weight on a single number, but I find more clinical value in the longitudinal assessment.
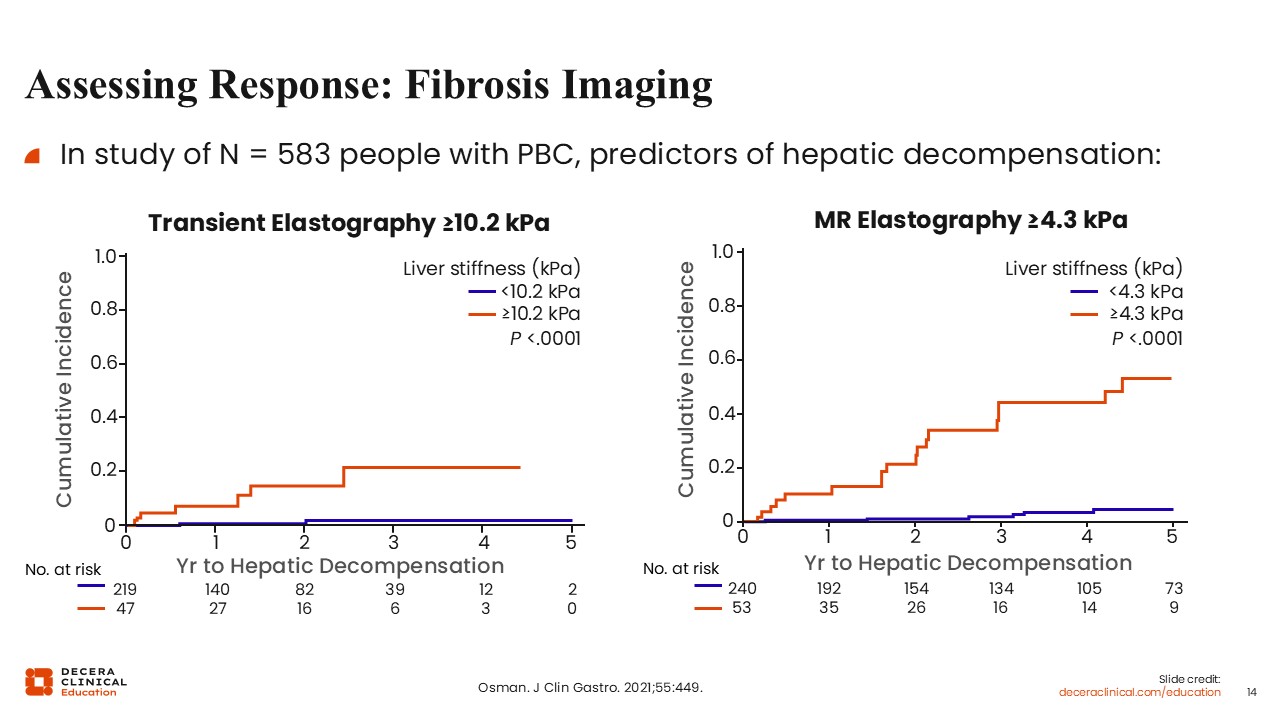
Assessing Response: Fibrosis Imaging
Liver stiffness is not itself a biochemical response criterion, but it can help identify patients who may warrant earlier and closer response assessment.
These data are particularly important because liver stiffness is a surrogate for disease severity. The higher the liver stiffness, the greater the probability of significant or advanced fibrosis.6,11
Take-home Points
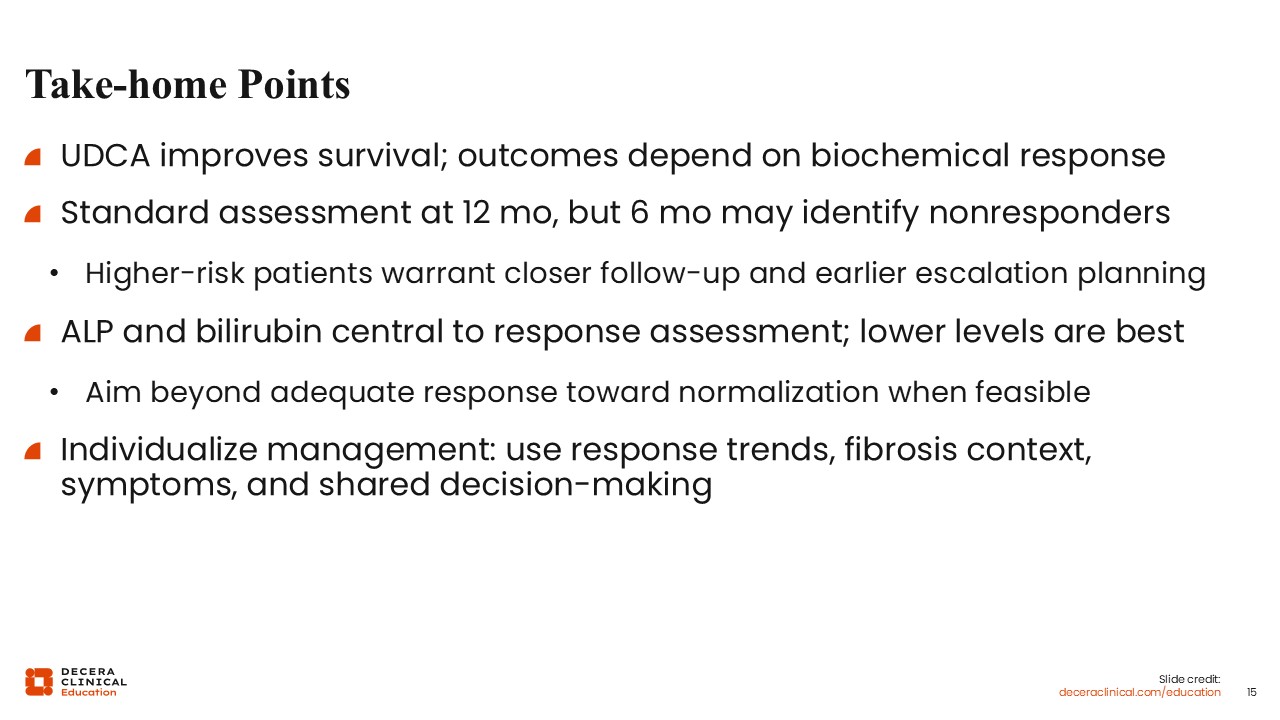
In summary, optimizing care for PBC requires thoughtful, ongoing assessment of biochemical response so that patients who are not on an adequate trajectory can be identified early and considered for treatment escalation when appropriate.
Traditional response assessment at 12 months remains important, but earlier and more frequent evaluation may be especially valuable for patients with higher-risk or more advanced disease.
Ultimately, response assessment in PBC should be individualized, risk-based, and focused on improving long-term outcomes through timely, proactive management.